


LMAX Exchange
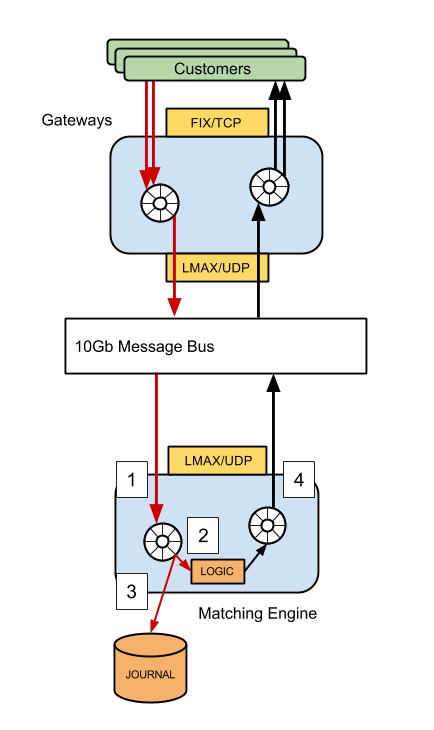
Focussing on the (simplified) matching engine, we can see that there are 4 threads of execution that will affect end-to-end latency if there is jitter present in the system (in reality, there are more, this diagram is for illustrative purposes only!).
- The thread which is polling the network for inbound traffic
- The thread that executes business logic, generating responses
- The journaller thread, which writes all in-bound messages to disk
- The publisher thread, responsible for sending responses back to the gateway
An example
System-jitter baseline
== Accumulator Message Transit Latency (ns) ==Â
mean         60879Â
min           76Â
50.00% Â Â Â Â Â Â Â Â 168Â
90.00% Â Â Â Â Â Â Â Â 256Â
99.00% Â Â Â Â Â Â 2228239Â
99.90% Â Â Â Â Â Â 8126495Â
99.99% Â Â Â Â Â Â 10485823Â
99.999% Â Â Â Â Â 11534399Â
99.9999% Â Â Â Â Â 11534399Â
max        11534399Â
count        3595101
Clearly something is happening on the system that is negatively affecting latency. Pauses introduced by the runtime (JVM) can be ruled out, as the application is garbage-free, performs warm-up cycles to exercise the JIT, and guaranteed safepoints are disabled. This can be confirmed by enabling safepoint logging, looking at the GC log and stdout output when -XX:+PrintCompilation is enabled.
CPU Speed
cat /sys/devices/system/cpu/cpu0/cpufreq/scaling_available_governors
which tells me that I have two choices:
- performance
- powersave
Before making a change though, let’s make sure that powersave is actually causing issues.
To do this, perf_events can be used to monitor the CPU’s P-state while the application is running:
perf record -e “power:cpu_frequency” -a
This command will sample the cpu_frequency trace point written to by the intel cpufreq driver on all CPUs. This information comes from an MSR on the chip which holds the FSB speed.
Filtering entries to include only those samples taken when java was executing shows some variation in the reported frequency; clearly not ideal for achieving the lowest latency:
java 2804 [003] 3327.796741: power:cpu_frequency: state=1500000 cpu_id=3Â
java 2804 [003] 3328.089969: power:cpu_frequency: state=3000000 cpu_id=3Â
java 2804 [003] 3328.139009: power:cpu_frequency: state=2500000 cpu_id=3Â
java 2804 [003] 3328.204063: power:cpu_frequency: state=1000000 cpu_id=3
This script can be used to set the scaling governor to performance mode to reduce the variation:
sudo bash ./set_cpu_governor.sh performance
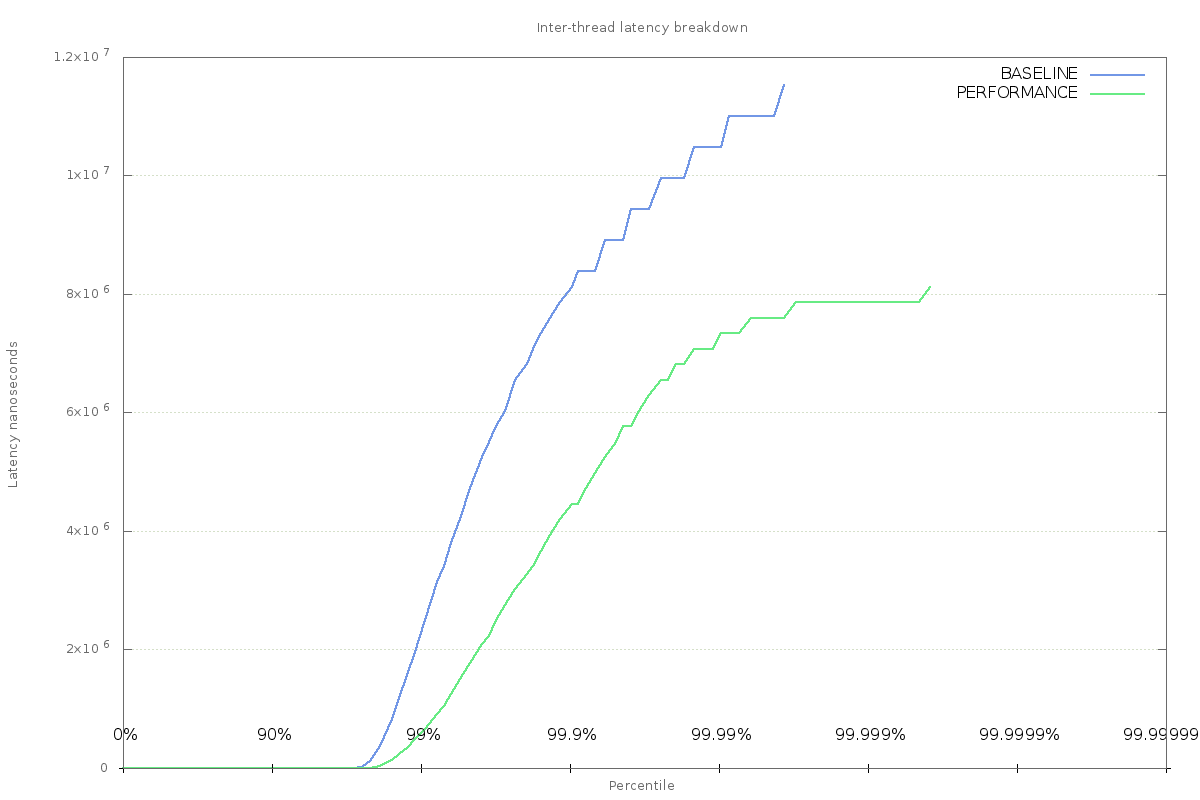
Running the application again with the performance governor enabled produces better results for inter-thread latency. Monitoring with perf shows that the cpu_frequency events are no longer emitted.
== Accumulator Message Transit Latency (ns) ==Â
mean          23882Â
min            84Â
50.00% Â Â Â Â Â Â Â Â Â 152Â
90.00% Â Â Â Â Â Â Â Â Â 208Â
99.00% Â Â Â Â Â Â Â Â 589827Â
99.90% Â Â Â Â Â Â Â 4456479Â
99.99% Â Â Â Â Â Â Â 7340063Â
99.999% Â Â Â Â Â Â Â 7864351Â
99.9999% Â Â Â Â Â Â 8126495Â
max          8126495Â
count         3595101
Though there is still a max latency of 8ms, it has been reduced from the previous value of 11ms.
Process migration
Another possible cause of scheduling jitter is likely to be down to the OS scheduler moving processes around as different tasks become runnable. The important threads in the application are at the mercy of the scheduler, which can, when invoked decide to run another process on the current CPU. When this happens, the running thread’s context will be saved, and it will be shifted back into the schedulers run-queue (or possibly migrated to another CPU entirely).
To find out whether this is happening to the threads in our application, we can turn to perf again and sample trace events emitted by the scheduler. In this case, sampling the sched_stat_runtime event will show what CPU has been playing host to the application threads.
One row of output from perf script shows that the java thread executed on CPU1 for a duration of 1.000825 milliseconds:
java 11372 [001] 3055.140623: sched:sched_stat_runtime: comm=java pid=11372 runtime=1000825 [ns] vruntime=81510486145 [ns]
A bit of sorting and counting will show exactly how the process was moved around the available CPUs during its lifetime:
perf script | grep “java 11372” | awk ‘{print $3}’ | sort | uniq -cÂ
…Â
16071 [000]Â
10858 [001]Â
 5778 [002]Â
 7230 [003]
So this thread mostly ran on CPUs 0 and 1, but also spent some time on CPUs 2 and 3. Moving the process around is going to require a context switch, and produce cache invalidation effects. While these are unlikely to be the sources of maximum latency, in order to start improving the worst-case, it will be necessary to stop migration of these processes.
Thread affinity
Thread affinity can be used to force processes to run on a specific CPU or set of CPUs. This achieved by either using taskset when launching a program, or the sched_setaffinity system call from within an application. Using this technique to stop process migration of latency-sensitive threads has a positive effect on the latency jitter experienced in the application:
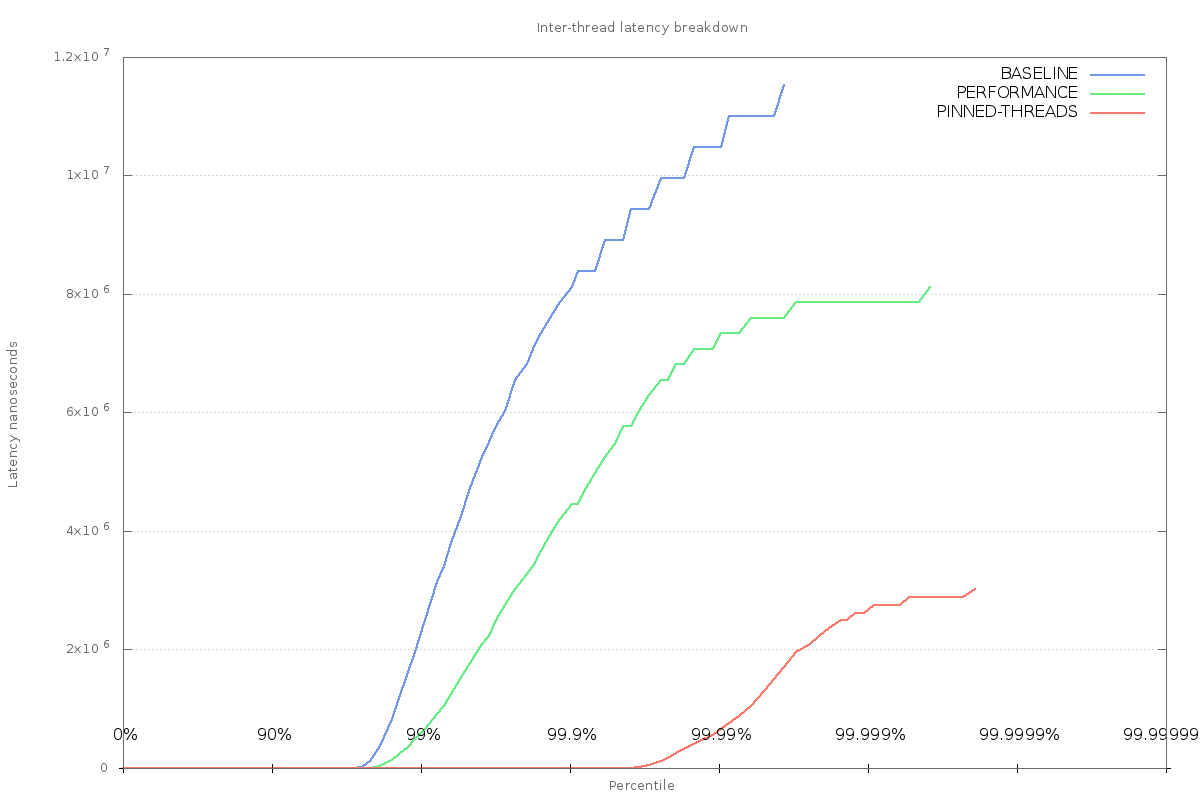
This result implies that forcing the threads to run on a single CPU can help reduce inter-thread latency. Whether this is down to the scheduler making better decisions about where to run other processes, or simply because there is less context switching is not clear.
One thing to look out for is the fact that no effort has been made to stop the scheduler from running other tasks on those CPUs. There are still multi-millisecond delays in message passing, and this could be down to other processes being run on the CPU that the application thread has been restricted to.
Returning to perf and this time capturing all sched_stat_runtime events for a specific CPU (in this case 1) will show what other processes are being scheduled while the application is running:
perf record -e “sched:sched_stat_runtime” -C 1
Stripping out everything but the process name, and counting occurrences in the event trace shows that while the java application was running most of the time, there are plenty of other processes that were scheduled during the application’s execution time:
45514 javaÂ
  60 kworker/1:2Â
  26 irq/39-DLL0665:Â
  24 rngdÂ
  15 rcu_schedÂ
  9 gmainÂ
  8 goa-daemonÂ
  7 chromeÂ
  6 ksoftirqd/1Â
  5 rtkit-daemon
CPU Isolation
At this point, it’s time to remove the target CPUs from the OS’s scheduling domain. This can be done with the isolcpus boot parameter (i.e. add isolcpus=<cpu-list> to grub.conf), or by using the cset command from the cpuset package.
Using this method, the scheduler is restricted from running other user-space processes on the CPUs hosting the latency-sensitive application threads. In combination with setting the thread affinity, this should mean that the application threads will always have CPU resource and will be effectively always running.
The difference in inter-thread latency is dramatic – maximum latency is down to 14 microseconds:
== Accumulator Message Transit Latency (ns) ==Â
mean          144Â
min              84Â
50.00% Â Â Â Â Â Â Â Â Â Â Â 144Â
90.00% Â Â Â Â Â Â Â Â Â Â Â 160Â
99.00% Â Â Â Â Â Â Â Â Â Â Â 208Â
99.90% Â Â Â Â Â Â Â Â Â Â Â 512Â
99.99% Â Â Â Â Â Â Â Â Â Â Â 2432Â
99.999% Â Â Â Â Â Â Â Â Â Â 3584Â
99.9999% Â Â Â Â Â Â Â Â Â 11776Â
max             14848Â
count           3595101Â
The difference is so great, that it’s necessary to use a log-scale for the y-axis of the chart.
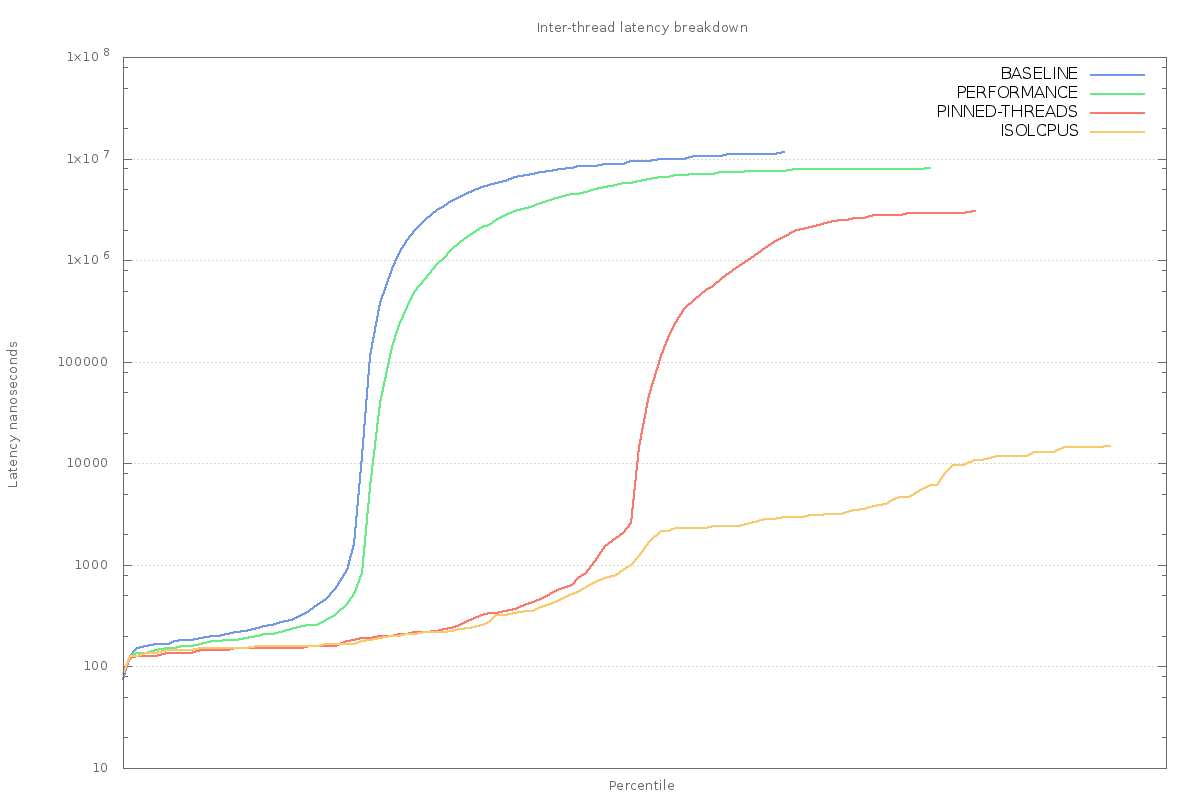
Note that the difference will not be so great on a server-class machine with lots of spare processing power. The effect here is magnified by the fact that the OS only has 4 CPUs (on my laptop) to work with, and a desktop distribution of Linux. So there is much more scheduling pressure than would be present on a server-class machine.
Using perf once again to confirm that other processes are not running on the reserved CPUs shows that there is still some contention to deal with:
81130 javaÂ
  2 ksoftirqd/1Â
  43 kworker/1:0Â
  1 kworker/1:1HÂ
  2 kworker/3:1Â
  1 kworker/3:1HÂ
  11 swapperÂ
These processes starting with ‘k’ are kernel threads that deal with house-keeping tasks on behalf of the OS, ‘swapper’ is the Linux idle process, which is scheduled whenever there is no work to be executed on a CPU.
Conclusion
This post has introduced some techniques for observing and fixing system jitter. Examples in the post were generated using the application available in this github repository, where there is also a walk-through of the steps used to generate the data for this post.
There’s more..
This post describes the start of the journey towards tuning Linux for low-latency applications taken at LMAX Exchange. Dealing with other causes of runtime jitter will be covered in an up-coming post.